State of the nation – The Long View— we’re better off than we’ve ever been
September 16, 2016 11:45 am | Posted in Opinions | Share now TwitterFacebook
Measure things pretty much any way you want, it’s impossible to ignore: Vanuatu is bigger, better, healthier and wealthier than it was.
We took a deep dive into the World Bank’s voluminous statistical database, and looked at a number of key indicators to see just how far we’ve come. In most cases, we went back as far into the past as the data allowed.
This may not do much to allay fears concerning our most pressing challenges, but if nothing else, it reminds us that we’ve been through worse, we’ve made do with less, and we still got through.
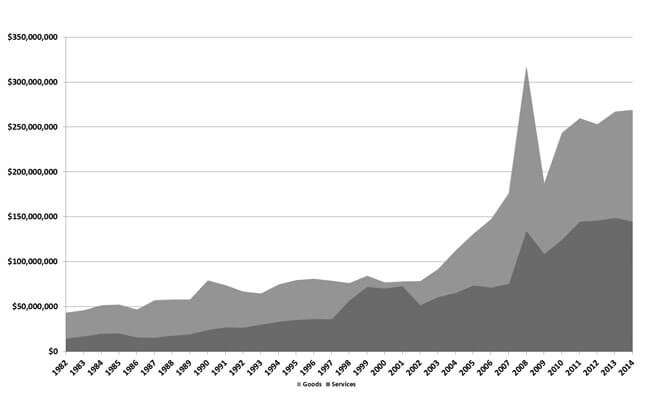
1. Goods & services imports (US$)
Argue how you like, and gripe about the hugely negative balance of trade, we’re still showing more activity now than we ever have by a long shot. Trade in services may have dropped a bit into 2014, but that’s almost certain to spike once the post-Pam numbers are taken into account.
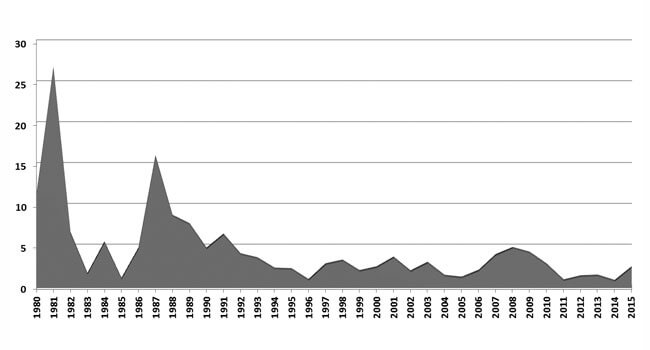
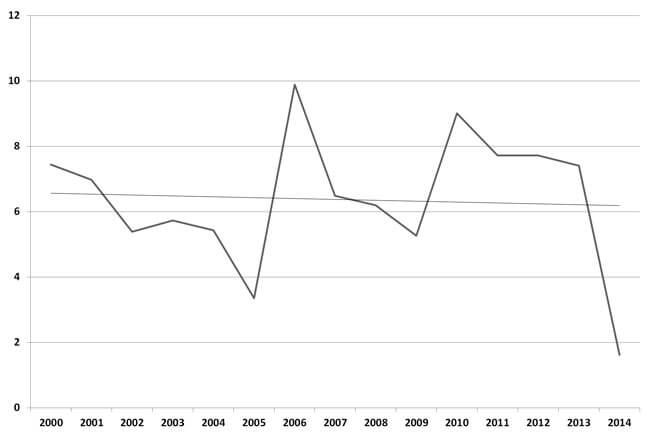
2. Inflation (%)
There’s no more vivid evidence of the turbulence of the post-independence period than an inflation rate that bucked like a bronco as the government dealt with successive crises and struggled to build a nation.
3. Foreign Direct Investment Net Inflows (% of GDP)
The glass-half-empty crowd will carp at the massive fall-off in FDI recently. More optimistic people will ask whether the decline is being offset by domestic investment.
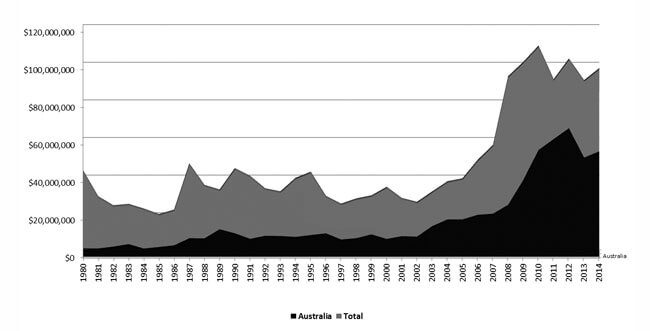
4. Aid flows (Australian vs Total Bilateral Aid Inflows)
Preach all you like about getting off the aid teat, the plain fact is that we’re achieving more than we ever have. The question is: are we spending the money as well as we could?
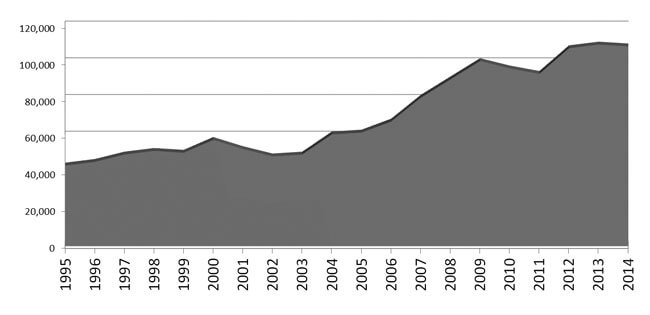
5. Tourist arrivals
Skeptics will complained that while the cost and ease of travel has improved vastly, we’ve only seen linear growth in arrival numbers. Visitor numbers to the islands are still vanishingly small in most cases. Optimists, on the other hand, will say we’re poised for a major leap after a decades-long bootstrapping process.
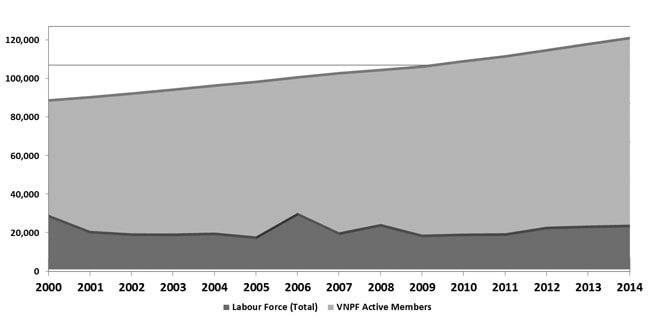
6. Labour Force engagement Labour (vs VNPF Active Members
Are we failing to bring the population into the cash economy, or are more and more people sloughing off their financial responsibilities? If tax base growth is just as poor, then we have a long row to hoe.